adventures in stunnel and elasticsearch
While deploying a 3 node HIPAA compliant Elasticsearch/Kibana cluster, we ran into a really weird issue where the nodes would disconnect/reconnect, every 12 hours or so. This includes TCP analysis of the connectivity issues, a glimpse into Elasticsearch node TCP connectivity and TCP keepalive settings, discovery of the root cause, and resolution of the connectivity issue.
Background
We deployed a “secure 3 node cluster”, one that used TLS everywhere; on the inbound elasticsearch clients, between nodes, in front of Kibana. This 3 node cluster would use stunnel to communicate between each node and nginx to server as 1) the Kibana front end and 2) the Elasticsearch client front end. To do this, we deploying the following on each node:
- Elasticsearch.
- Kibana.
- NGINX. This presented the CLIENT interface of Elasticsearch to applications as well as the Kibana interface for users.
- Stunnel. This would serve as the encrypted termination point for the intra-node communication.
Instances are deployed using Terraform and Ansible. We currently use CFSSL for certification generation (also looking at what Hashicorp Vault can bring us) for the client facing NGINX service and the intra-node stunnel communication. Prometheus is used to monitor the nodes and the cluster health. That is where the problems were first noticed; Our monitoring system began firing alerts and showing the cluster going yellow… Elasticsearch, why you no work?
stunnel configuration
Before diving into the issue, a quick look at the stunnel configuration. In this case, we use stunnel to secure intra-node communications. Encrypted tunnels are established between each node and Elasticsearch communicates with the localhost listener.
So, stunnel operates in server mode on the public facing interface, and Elasticsearch es-1 talks to es-2 and es-3 via stunnel connections on the localhost (which connects to the OTHER stunnel server interfaces). This provides an intra-cluster TLS configuration. In picture form:
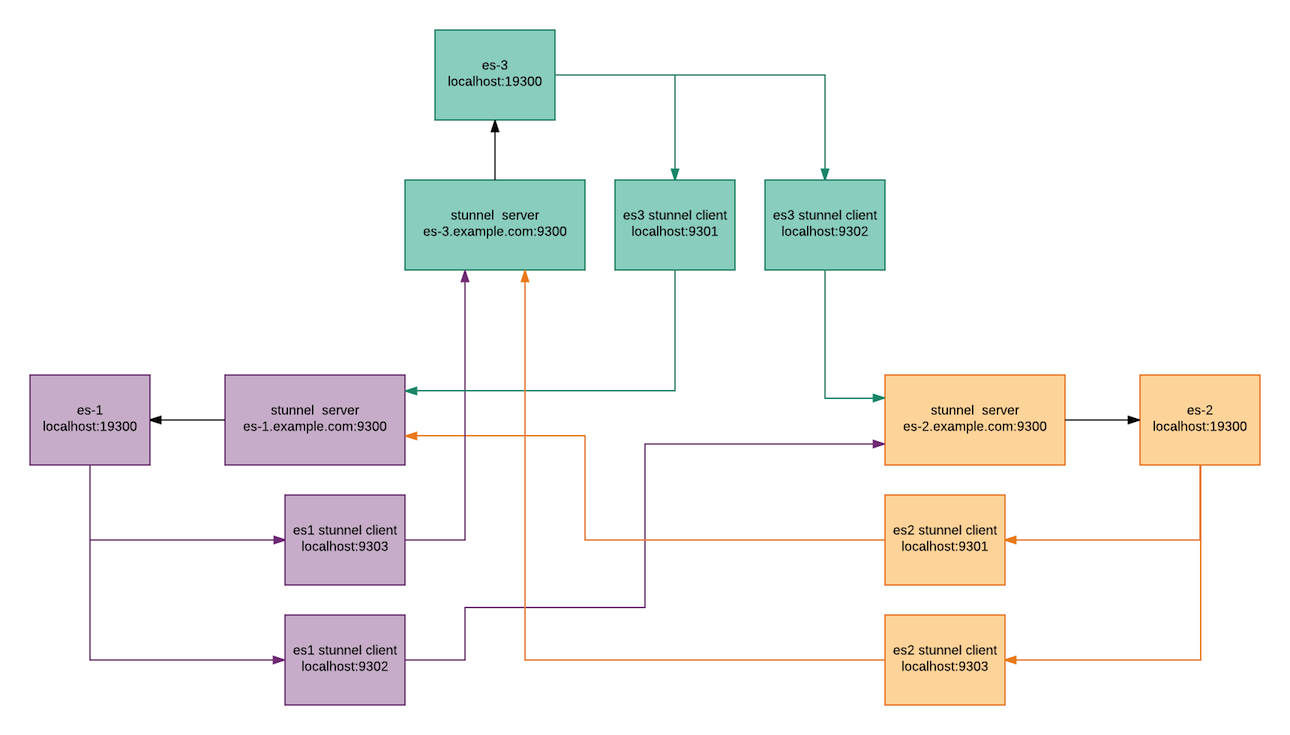
(Clients connect through an NGINX front end for Elasticsearch, not covered here…)
The Disconnect/Reconnect 12 Hour Cycle
And that’s where the story begins. Seemingly at random, a node would lose connectivity to the cluster, the cluster health would go yellow, and shards would initialize/relocate. The node would reconnect quickly, shards rebalance, and the cluster would return to green. This would happen a few times, regardless of load on the cluster. It happened on unused clusters and on heavily accessed clusters.
What was going on? The first break was immediately noticing the trend; this disconnect/reconnect cycle would happen back to back to back on each node. This matched up with how they were started. When they were last upgraded, they were upgraded in sequential fashion and thus stuck out like a sore thumb. It was very obvious this was happening every 12 hours.
Elasticsearch logs would show something like the following:
Apr 15 09:06:45 es-1 docker[1493]: [2017-04-15T09:06:45,072][INFO ][o.e.d.z.ZenDiscovery     ] [es-1] master_left [{es-2}{eitgh3KoT03-ABC06TdF_Q}{ZXcdR2UjTFOiH_eX4pYNwP}{localhost}{127.0.0.1:9302}], reason [transport disconnected]
Apr 15 09:06:45 es-1 docker[1493]: [2017-04-15T09:06:45,074][WARN ][o.e.d.z.ZenDiscovery     ] [es-1] master left (reason = transport disconnected), current nodes: nodes:
Apr 15 09:06:45 es-1 docker[1493]:    {es-3}{CJXXyFWPRHq0n7_64gwN0Q}{xhupYHW7TvGoYX4fFKWfzQ}{localhost}{127.0.0.1:9303}
Apr 15 09:06:45 es-1 docker[1493]:    {es-1}{iwtuKYM4R82qdy-0rt2syQ}{Qg0k9rfKRsic11CbXWsm9Q}{localhost}{127.0.0.1:9301}, local
Apr 15 09:06:45 es-1 docker[1493]: [2017-04-15T09:06:45,074][INFO ][o.e.c.s.ClusterService   ] [es-1] removed {{es-2}{eitgh3KoT03-ABC06TdF_Q}{ZXcdR2UjTFOiH_eX4pYNwP}{localhost}{127.0.0.1:9302},}, reason: master_failed ({es-2}{eitgh3KoT03-ABC06TdF_Q}{ZXcdR2UjTFOiH_eX4pYNwP}{localhost}{127.0.0.1:9302})
Apr 15 09:06:48 es-1 docker[1493]: [2017-04-15T09:06:48,166][INFO ][o.e.c.s.ClusterService   ] [es-1] detected_master {es-2}{eitgh3KoT03-ABC06TdF_Q}{ZXcdR2UjTFOiH_eX4pYNwP}{localhost}{127.0.0.1:9302}, added {{es-2}{eitgh3KoT03-ABC06TdF_Q}{ZXcdR2UjTFOiH_eX4pYNwP}{localhost}{127.0.0.1:9302},}, reason: zen-disco-receive(from master [master {es-2}{eitgh3KoT03-ABC06TdF_Q}{ZXcdR2UjTFOiH_eX4pYNwP}{localhost}{127.0.0.1:9302} committed version [88163]])
Straight up disconnect. Stunnel logs showed connection resets:
# journalctl  -u stunnel.service | grep "Connection reset"
Apr 15 09:06:43 es-1 docker[1481]: 2017.04.15 09:06:43 LOG5[931]: Connection reset: 0 byte(s) sent to TLS, 0 byte(s) sent to socket
Apr 15 09:06:45 es-1 docker[1481]: 2017.04.15 09:06:45 LOG3[942]: TLS fd: Connection reset by peer (104)
Apr 15 09:06:45 es-1 docker[1481]: 2017.04.15 09:06:45 LOG3[941]: TLS fd: Connection reset by peer (104)
Apr 15 09:06:45 es-1 docker[1481]: 2017.04.15 09:06:45 LOG3[937]: TLS fd: Connection reset by peer (104)
Apr 15 09:06:45 es-1 docker[1481]: 2017.04.15 09:06:45 LOG3[945]: TLS fd: Connection reset by peer (104)
Apr 15 09:06:45 es-1 docker[1481]: 2017.04.15 09:06:45 LOG3[948]: TLS fd: Connection reset by peer (104)
Apr 15 09:06:45 es-1 docker[1481]: 2017.04.15 09:06:45 LOG3[938]: TLS fd: Connection reset by peer (104)
Apr 15 09:06:45 es-1 docker[1481]: 2017.04.15 09:06:45 LOG3[950]: TLS fd: Connection reset by peer (104)
Apr 15 09:06:45 es-1 docker[1481]: 2017.04.15 09:06:45 LOG5[952]: Connection reset: 0 byte(s) sent to TLS, 0 byte(s) sent to socket
Apr 15 09:06:45 es-1 docker[1481]: 2017.04.15 09:06:45 LOG5[963]: Connection reset: 0 byte(s) sent to TLS, 0 byte(s) sent to socket
Apr 15 09:06:45 es-1 docker[1481]: 2017.04.15 09:06:45 LOG5[974]: Connection reset: 0 byte(s) sent to TLS, 0 byte(s) sent to socket
Apr 15 09:06:45 es-1 docker[1481]: 2017.04.15 09:06:45 LOG5[978]: Connection reset: 0 byte(s) sent to TLS, 0 byte(s) sent to socket
Apr 15 09:06:45 es-1 docker[1481]: 2017.04.15 09:06:45 LOG5[964]: Connection reset: 0 byte(s) sent to TLS, 0 byte(s) sent to socket
Apr 15 09:06:45 es-1 docker[1481]: 2017.04.15 09:06:45 LOG5[973]: Connection reset: 0 byte(s) sent to TLS, 0 byte(s) sent to socket
Connections reset by peer AND connection resets sent. Every 12 hours we’re getting reset. The immediate thought was it was a keepalive issue. Something was causing stunnel to think a connection was dead and firing off resets.
Here’s the thing, stunnel is configured with a keepalive. The global configuration that was truncated above, had the following:
socket = a:SO_REUSEADDR=1

socket = l:SO_KEEPALIVE=1
socket = r:SO_KEEPALIVE=1

socket = l:TCP_NODELAY=1
socket = r:TCP_NODELAY=1

socket = r:TCP_KEEPIDLE=15
socket = r:TCP_KEEPINTVL=5
socket = r:TCP_KEEPCNT=5

socket = l:TCP_KEEPIDLE=15
socket = l:TCP_KEEPINTVL=5
socket = l:TCP_KEEPCNT=5
Stunnel was indeed sending keepalives. More investigation required.
forcing the issue
Keepalives are a funky thing. The application is required to set a flag, while the OS manages the keepalives.
So, any good debugging method requires recreating the problem. In this case, the keepalive settings were a bit more aggressive:
echo 60 > /proc/sys/net/ipv4/tcp_keepalive_time
echo 10 > /proc/sys/net/ipv4/tcp_keepalive_intvl
echo 4 > /proc/sys/net/ipv4/tcp_keepalive_probes
This cause the OS to wait 60 seconds, then send keepalives every 10 seconds, with 4 failures causing a timeout. So now we have stunnel with an application level TCP keepalive and the OS with an aggressive 10 second keepalive.
Turning the debugging up on stunnel, it becomes very apparent what the issue is:
Apr 16 04:45:23 es-1 docker[4191]: 2017.04.16 04:45:23 LOG6[14]: transfer: s_poll_wait: TIMEOUTidle exceeded: sending reset
Now, why? tcpdump on one of the local ports reveals plenty of keepalives:
root@es-1:~# tcpdump -i lo -nn tcp port 33368
tcpdump: verbose output suppressed, use -v or -vv for full protocol decode
listening on lo, link-type EN10MB (Ethernet), capture size 262144 bytes
01:53:16.620567 IP 127.0.0.1.9302 > 127.0.0.1.33368: Flags [.], ack 1969209591, win 342, options [nop,nop,TS val 204488600 ecr 204484848], length 0
01:53:16.620585 IP 127.0.0.1.33368 > 127.0.0.1.9302: Flags [.], ack 1, win 342, options [nop,nop,TS val 204488600 ecr 204473664], length 0
01:53:17.036571 IP 127.0.0.1.33368 > 127.0.0.1.9302: Flags [.], ack 1, win 342, options [nop,nop,TS val 204488704 ecr 204473664], length 0
01:53:17.036592 IP 127.0.0.1.9302 > 127.0.0.1.33368: Flags [.], ack 1, win 342, options [nop,nop,TS val 204488704 ecr 204488600], length 0
01:53:31.628570 IP 127.0.0.1.9302 > 127.0.0.1.33368: Flags [.], ack 1, win 342, options [nop,nop,TS val 204492352 ecr 204488600], length 0
01:53:31.628583 IP 127.0.0.1.33368 > 127.0.0.1.9302: Flags [.], ack 1, win 342, options [nop,nop,TS val 204492352 ecr 204488704], length 0
01:53:46.636569 IP 127.0.0.1.9302 > 127.0.0.1.33368: Flags [.], ack 1, win 342, options [nop,nop,TS val 204496104 ecr 204492352], length 0
01:53:46.636583 IP 127.0.0.1.33368 > 127.0.0.1.9302: Flags [.], ack 1, win 342, options [nop,nop,TS val 204496104 ecr 204488704], length 0
01:54:01.644600 IP 127.0.0.1.9302 > 127.0.0.1.33368: Flags [.], ack 1, win 342, options [nop,nop,TS val 204499856 ecr 204496104], length 0
01:54:01.644615 IP 127.0.0.1.33368 > 127.0.0.1.9302: Flags [.], ack 1, win 342, options [nop,nop,TS val 204499856 ecr 204488704], length 0
01:54:16.652568 IP 127.0.0.1.9302 > 127.0.0.1.33368: Flags [.], ack 1, win 342, options [nop,nop,TS val 204503608 ecr 204499856], length 0
01:54:16.652585 IP 127.0.0.1.33368 > 127.0.0.1.9302: Flags [.], ack 1, win 342, options [nop,nop,TS val 204503608 ecr 204488704], length 0
01:54:17.196575 IP 127.0.0.1.33368 > 127.0.0.1.9302: Flags [.], ack 1, win 342, options [nop,nop,TS val 204503744 ecr 204488704], length 0
01:54:17.196597 IP 127.0.0.1.9302 > 127.0.0.1.33368: Flags [.], ack 1, win 342, options [nop,nop,TS val 204503744 ecr 204503608], length 0
^C
14 packets captured
28 packets received by filter
0 packets dropped by kernel
(what you’re seeing above is the local stunnel port communicating with the Elasticsearch client)
ES mesh network and the discovery
So, what the hell is Elasticsearch doing? Well, it’s like a Facebook status; it’s complicated. When Elasticsearch starts up, it makes many connections to each node; 13 to be exact. ES calls them “channels”, but they’re TCP connections. Some info on them:
recovery: 2 channels for the recovery of indexes
bulk: 3 channels for low priority bulk based operations such as bulk indexing. Previously called low.
reg: 6 channels for medium priority regular operations such as queries. Previous called med.
state: 1 channel dedicated to state based operations such as changes to the cluster state. Previously called high.
ping: 1 channel dedicated to pings between the instances for fault detection.
That’s cool. But shit gets real. Real fast. You’ve got a bunch of connections open. I sure hope Elasticsearch takes care of them. Let’s check out some docs
network.tcp.keep_alive Enable or disable TCP keep alive. Defaults to true.
Oh, sweet. ES does this for me. Or does it?
Elasticsearch has support for TCP keepalive which is not explicitly set by default. This prevents unused or idle channels from being closed, which would otherwise cascade into a complete disconnect-reconnect cycle as explained above.
So… it’s not on by default? It seems the answer is quite mixed. From what I’ve observed, it seems that by default some channels get keepalives, while others do not and sit idle.
And that second sentence is particularly beefy… If ANY connection gets closed, the Elasticsearch node disconnects and reconnects COMPLETELY. So basically, you have a bunch of connections open; if a firewall or something determines that a connection has timed out due to inactivity, it can often issue a TCP reset (or just end the connection silently). And if one of those TCP resets fires against ONE of those 13 connections, ES will disconnect EVERY CONNECTION and recycle the connection to the node, throwing your cluster into a degraded state.
And ES most certainly leaves some of them open and do nothing with them by default. No keep alive. No nothing. An idle connection sitting there, as a time bomb to throw your cluster awry. As soon as ES determines that connection is no good, it will nuke ALL connections.
Now for most LANs, this is most likely never an issue. But if there is ANY network complexity, TCP keepalives and timeouts MUST be taken into account.
the simple solution
Back to the ES. How can this repeated death rattle of an Elasticsearch degraded cluster be avoided? Seems the magic settings were as follows:
network.tcp.keep_alive: true
transport.ping_schedule: 5s
Once enabled, ES managed ALL connections properly and the repeated flailing cluster stopped. TCP keepalives properly sent all 13 Elasticsearch connections maintained.
summary
Elasticsearch uses 13 connections between each node. Some of them sit idle. Be alert to what Elasticsearch does and the network topology it runs on. If there is any complexity, TCP keepalives should be enabled and configured, as Elasticsearch doesn’t maintain all of them by default.
-b
links
- Elasticsearch networking - https://www.elastic.co/blog/found-elasticsearch-networking
- Elasticsearch networking settings - https://www.elastic.co/guide/en/elasticsearch/reference/current/modules-network.html
- Elasticsearch networking blog - http://blog.trifork.com/2015/04/08/dealing-with-nodenotavailableexceptions-in-elasticsearch/