a Prometheus exporter for Cryptocurrency values using the Coinmarketcap API

I’ve been really into Cryptocurrencies a lot lately. I don’t know what the future will hold, but the idea of decentralized trust and the potential around all things blockchain is really exciting. I’m often tracking what is going on and what these new financial markets are up to. One site I visit quite often is https://coinmarketcap.com. As I looked at their interface, I couldn’t help but think that a lot of this data would fit into a Prometheus/Grafana stack. I use Prometheus/Alertmanager/Grafana a lot. I’m a big fan of the tool. Prometheus is a monitoring server and after coming from things like Nagios and Icinga, it’s refreshingly clean and simple. All Prometheus does is essentially curl an endpoint, gets a list of items and their current numerical value (like, CPU=.55, or 55%), then stores it. This numerical data can then be used to build charts, graphs, and other visualizations.
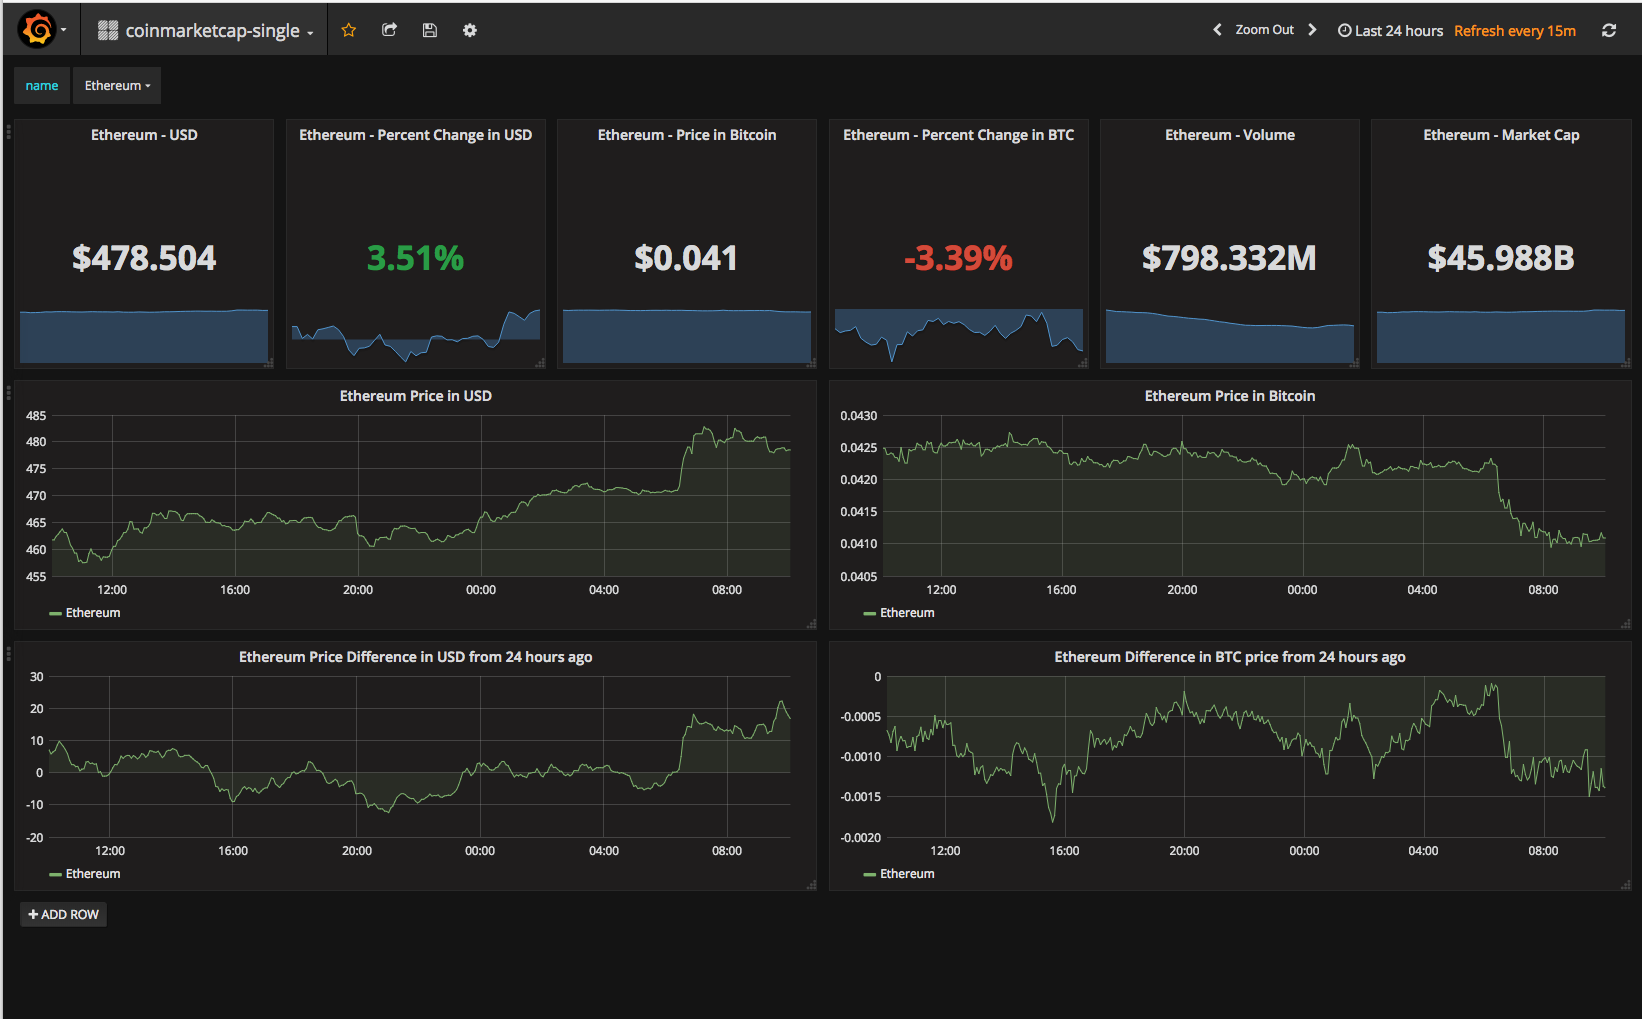
When coupled with Grafana, you can take that time series data and create some great metrics on it.
And that’s where this idea came from. Why not create an HTTP endpoint that would give me the price of these Cryptocurrencies in USD and all the other potential metrics? From that, I could write custom queries against that data and build dashboards like the simple one above?
This post walks through the coinmarketcap-exporter code. It covers:
- Accessing the Coinmarketcap API.
- The Python code used to build the Prometheus exporter.
- The docker-compose file to run/test the exporter, Prometheus, and Grafana.
- An example Grafana dashboad.
And this example visualization when it’s all said and done:
Here’s a look at some of the code.
scraping the Coinmarketcap.com API
Shout out to the crew running https://coinmarketcap.com, love this site. Scraping the API with Python was pretty straightforward:
self.endpoint = 'https://api.coinmarketcap.com/v1/ticker/'
r = requests.get(self.endpoint)
request_time = r.elapsed.total_seconds()
response = json.loads(r.content.decode('UTF-8'))
The Coinmarketcap.com API returns straightfoward JSON and their sample response was incredibly helpful. From their API site, this looks something like this:
[
    {
        "id": "bitcoin",
        "name": "Bitcoin",
        "symbol": "BTC",
        "rank": "1",
        "price_usd": "573.137",
        "price_btc": "1.0",
        "24h_volume_usd": "72855700.0",
        "market_cap_usd": "9080883500.0",
        "available_supply": "15844176.0",
        "total_supply": "15844176.0",
        "percent_change_1h": "0.04",
        "percent_change_24h": "-0.3",
        "percent_change_7d": "-0.57",
        "last_updated": "1472762067"
    },
...
The above Python code gathers this response. From the above code, we can output the symbol for each coin:
for each in response:
  print each['symbol']
Now we can create some Prometheus metrics.
forming the Prometheus metric
The first metric collected is the amount of time it takes Coinmarketcap to respond:
metric = Metric('coinmarketcap_response_time', 'Total time for the coinmarketcap API to respond.', 'summary')
# add the response time as a metric
metric.add_sample('coinmarketcap_response_time', value=float(request_time), labels={'name': 'coinmarketcap.com'})
I’ve seen it usually take about .2 to .5 seconds (it obviously varies). A niceity to measure. It was a good first test as the exporter was being developed.
Gathering the actual Cryptocurrency value looks like:
metric = Metric('coin_market', 'coinmarketcap metric values', 'summary')
for each in response:
  for that in ['rank', 'price_usd', 'price_btc', '24h_volume_usd', 'market_cap_usd', 'available_supply', 'total_supply', 'percent_change_1h', 'percent_change_24h', 'percent_change_7d']:
    coinmarketmetric = '_'.join(['coin_market', that])
    metric.add_sample(coinmarketmetric, value=float(each[that]), labels={'id': each['id'], 'name': each['name'], 'symbol': each['symbol']})
yield metric
Basically, for each Cryptocurrency scraped, take each metric that we want to observe, and walk through those, adding them all the to sample.
the HTTP listener
In the Prometheus model, the server scrapes endpoints/exporters. The exporters job is to simply gather the data and present it as HTTP to whatever centralized monitoring server there is. Now the exporter needs to provide this endpoint. With the Prometheus Python client, it’s super simple…
REGISTRY.register(CoinCollector())
start_http_server(int(args.port))
The args.port is a TCP port that is passed in on the CLI and defaults to 9101.
If the exporter is accessed using curl, the HTTP response would look something like this:
➜  coinmarketcap-exporter git:(master) ✗ curl -s http://localhost:9101/metrics | grep coin_market_price_btc
coin_market_price_btc{id="bitcoin",name="Bitcoin",symbol="BTC"} 1.0
coin_market_price_btc{id="ethereum",name="Ethereum",symbol="ETH"} 0.0407949
coin_market_price_btc{id="bitcoin-cash",name="Bitcoin Cash",symbol="BCH"} 0.139334
coin_market_price_btc{id="ripple",name="Ripple",symbol="XRP"} 2.188e-05
coin_market_price_btc{id="dash",name="Dash",symbol="DASH"} 0.067378
coin_market_price_btc{id="litecoin",name="Litecoin",symbol="LTC"} 0.00899746
coin_market_price_btc{id="bitcoin-gold",name="Bitcoin Gold",symbol="BTG"} 0.028234
coin_market_price_btc{id="iota",name="IOTA",symbol="MIOTA"} 0.00016372
...
integrating Prometheus
Getting Prometheus to scrape the endpoint is straightforward. The prometheus.yml configuration looks like:
scrape_configs:
  - job_name: 'coinmarketcap'
    static_configs:
      - targets: ['coinmarketcap-exporter:9101']
Note, the above Prometheus configuration is from the prometheus-compose directory.
Gafana and docker-compose
Part of the docker-compose stack is Grafana. Grafana provides a way for visualization of the Prometheus data gathered from the coinmarketcap exporter. It uses localhost ports 3000 and 9090.
To use:
- Start the docker-compose stack:
docker-compose up
- Go to http://localhost:3000. Log in as
admin/admin. - To import the dashboard, click the “Home” button at the top, then on the right, click “Import Dashboard”.
- Enter
3890in the “Grafana.com Dashboard” field. This imports a coinmarketcap-single Grafana dashboard. - Select the “prometheus” data source.
- Modify the other settings as preferred. Click “Import”.
- The new dashboard should be selectable and found at http://localhost:3000/dashboard/db/coinmarketcap-single.
- The Prometheus interface can be accessed at http://localhost:9090
summary
Overall it was fun to work through some of the tricks of setting up a Python Prometheus exporter. Some of the big value is using that collected data to measure, graph, and configure alerting. It will be useful for future development. Really appreciative of Coinmarketcap and their API, the entire site is smooth and responsive.
links
- Github - https://github.com/bonovoxly/coinmarketcap-exporter
- Grafana dashboard - https://grafana.com/dashboards/3890
- Coinmarketcap - https://coinmarketcap.com/
- Writing Prometheus exporters - https://prometheus.io/docs/instrumenting/writing_exporters/
- Writing JSON exporters in Python from Robust Perception - https://www.robustperception.io/writing-json-exporters-in-python/